Speed-Wiz Graph Editing Features
Speed-Wiz allows you to customize the view of graphs after they have been generated.
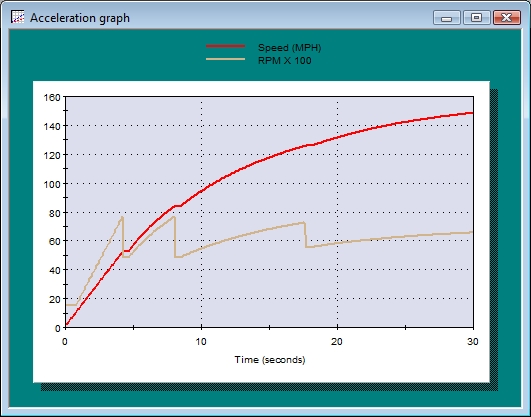
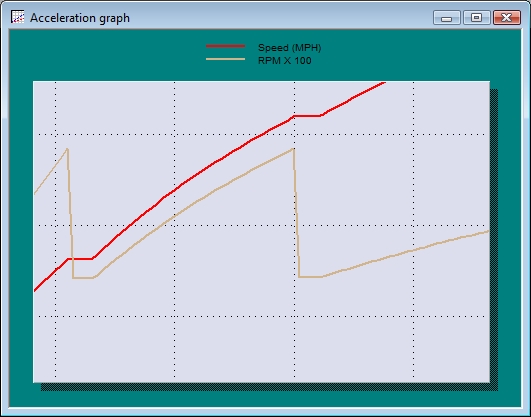
We start with an example acceleration graph
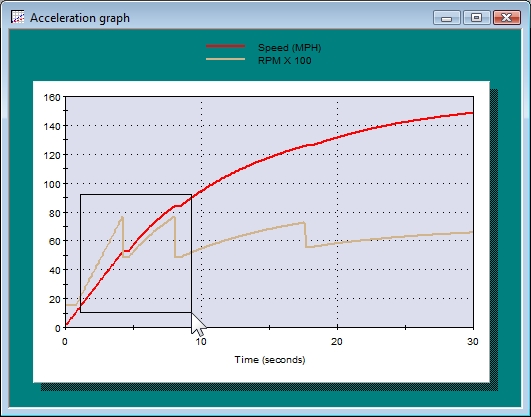
Use your mouse to select a region of interest
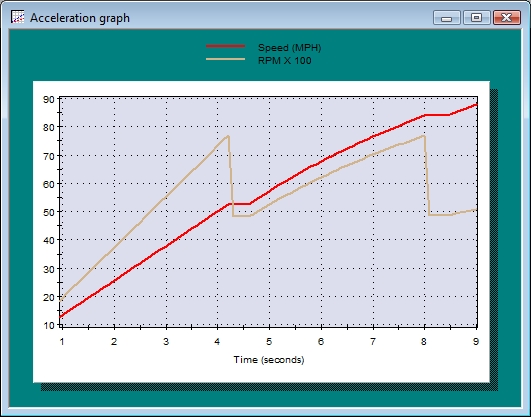
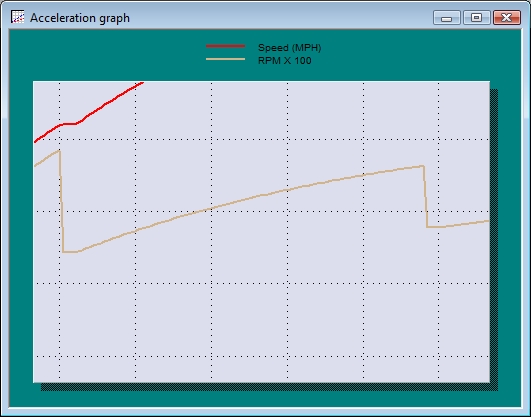
The graph is now shown zoomed in on the selected region
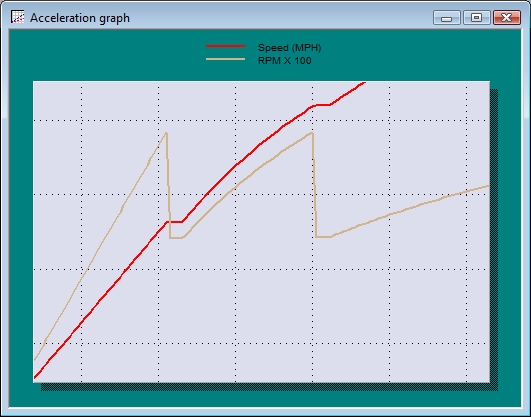
You can also zoom without keeping the units of measure
The graph can also be interactively zoomed in and out
The graph can also be panned (moved) in any direction
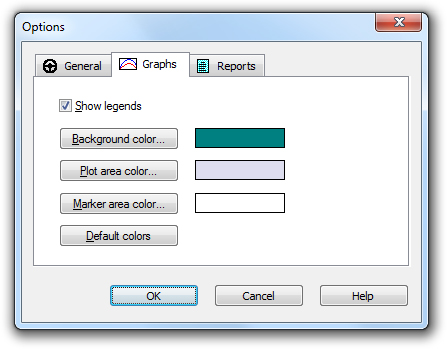
Graphs can be customized in the Graph options dialog