Acceleration Table
The acceleration table is one of the outputs that display the results of the acceleration simulation. For a graphical, animated display of the simulation, or a graph, see the acceleration plot.
The simulation is based on the inputs from the acceleration input window.
The acceleration table displays a complete acceleration simulation from 0 to 30 seconds. You select a display increment (the "step size" between each line, which determines how many lines are shown and how "far apart" they are - that is, how much detail is contained in the table). You can select whether to base the display increment on time, speed, distance, or RPM. For each of these options you can indicate the step (just type it in). In the example below, the user has asked for the simulation to be shown in time increments of one-half second. It could also be shown, for example, in speed increments of 10 MPH, distance increments of 25 feet, or engine speed increments of 250 RPM.
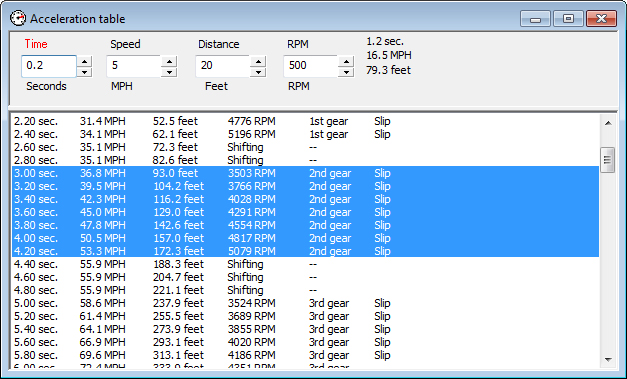
You can highlight a portion of the table and the elapsed time, speed and distance for that portion of the acceleration simulation are displayed at the top right. This is useful for analyzing portions of an acceleration run. In the example above, the time period spent in second gear, from 3.0 to 4.5 seconds is selected. During this 1.5-second period, the car gained 19.2 MPH and traveled 103.8 feet.
Various notes can be displayed in the right-hand column. "Slip" indicates that the power-to-traction ratio was sufficient to cause wheelspin.